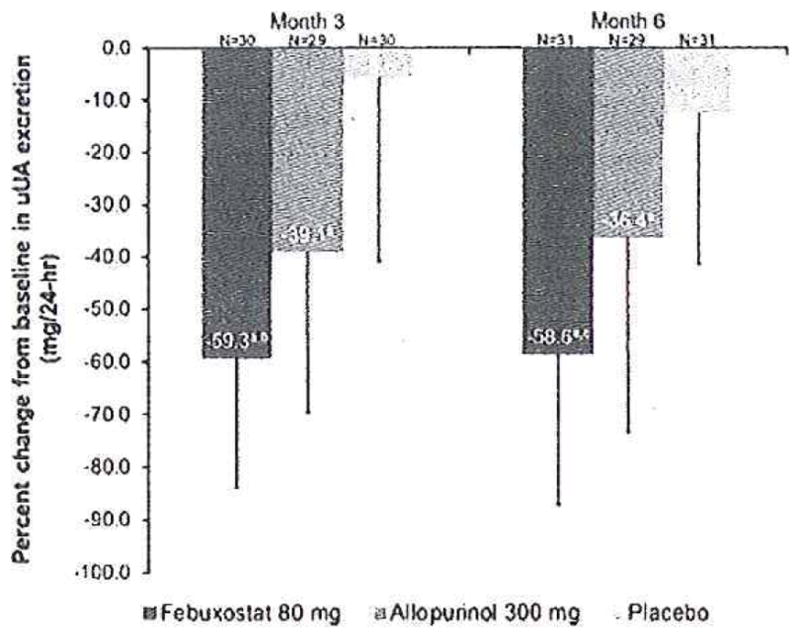
Fig. 1.

Percent change from baseline to months 3 and 6 in 24-h urinary uric acid (uUA) excretion, ap=0.001 vs. placebo; bp = 0.008 VS. allopurinol; cp = 0.003 vs. allopurinol. Error bars represent the standard deviation (SD) for each data point. Reproduced from [14] with permission
