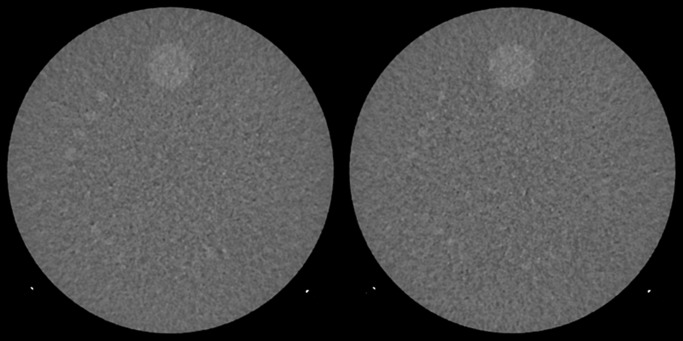
Figure 2:

Example images show the effect of statistical variation on LCR. These images were acquired with two separate scans but the exact same scanning parameters and reconstruction settings. The 6-mm rods are clearly seen on the left image but not on the right image. Display window width and window level are 100 HU and 100 HU, respectively, as required by the ACR CT Accreditation Program.
