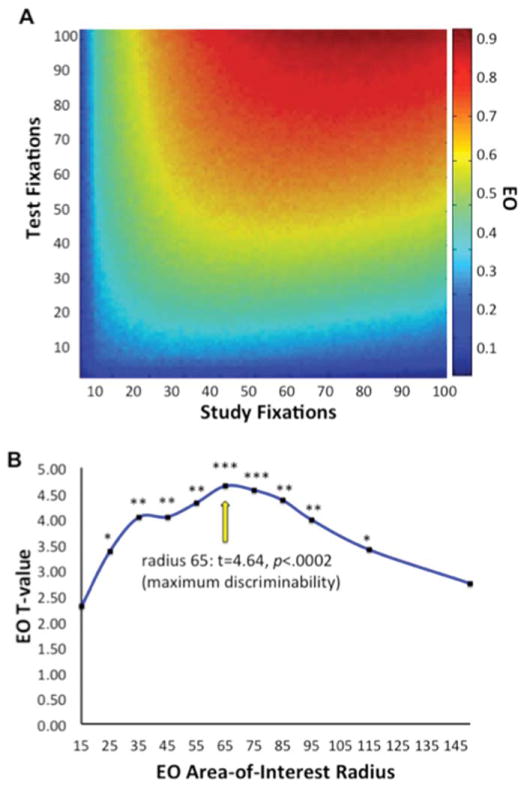
FIGURE 2.
Calculation of exploration overlap (EO). (A) EO values as a function of number of fixations at study and test, derived from simulation. Values were used to normalize EO by the number of study and test fixations for all analyses. (B) t Values of discriminability of study-similar scene pairs from study-new scene pairs using EO values as a function of spotlight radius used in the calculation of EO. Maximum discriminability based on EO occurred when EO was calculated using a radius of 65 pixels (~3° of visual angle). *P < 0.005; **P < 0.0005; ***P < 0.0002. [Color figure can be viewed in the online issue, which is available at wileyonlinelibrary.com.]

