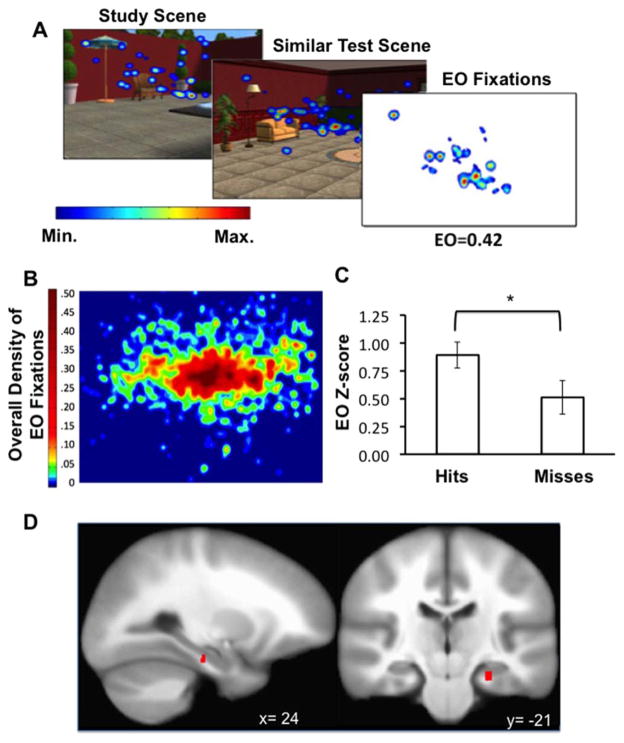
FIGURE 4.
EO association with hippocampal activity. (A) Example heatmap of mean fixations for a study scene, the corresponding similar test scene, and corresponding thresholded map of the fixations that contributing to the raw EO value. (B) Density map of the fixations that contributed to EO values for all scene pairs and all participants. (C) Mean z-scored EO values for similarity hits versus similarity misses. (D) Right hippocampal body activity corresponding to EO. *P < 0.005. Error bars indicate SE. [Color figure can be viewed in the online issue, which is available at wileyonlinelibrary.com.]

