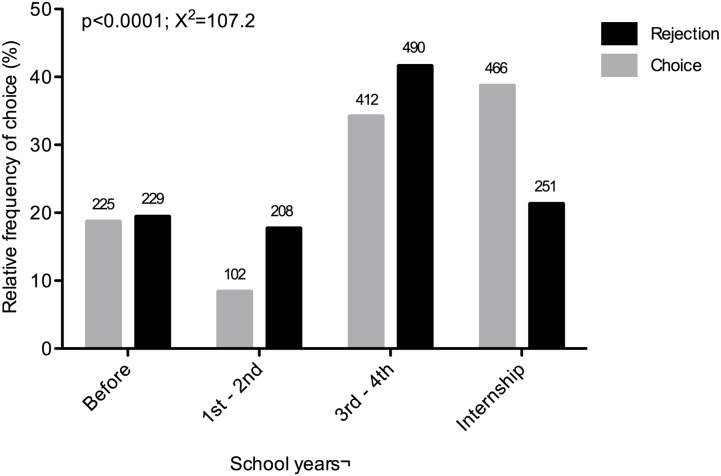
Fig 1. Period of choice and rejection of medical specialties.
The figure presents the temporal distribution (in school years) of choice and rejection of self-declared first-option specialties. The gray columns represent the choice of specialty. The black columns represent the rejection of specialties. The numbers above the columns represent the absolute frequency of choice/rejection in the corresponding period.

