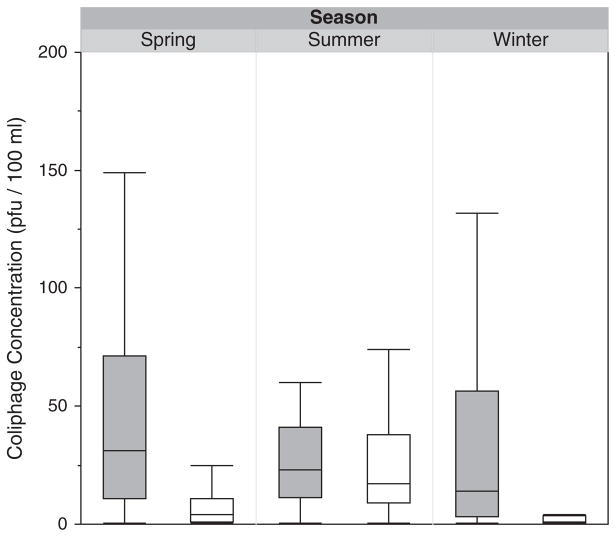
Fig. 2.
Box and whisker plot depicting the concentration (in PFU per 100 ml) of somatic (gray) and F+ coliphages (white) sorted by season. The lower boundary of the box indicates the 25th percentile, the line within the box represents the median, and the boundary of the box farthest from zero indicates the 75th percentile. Whiskers below and above the box indicate the 10th and 90th percentiles, respectively.

