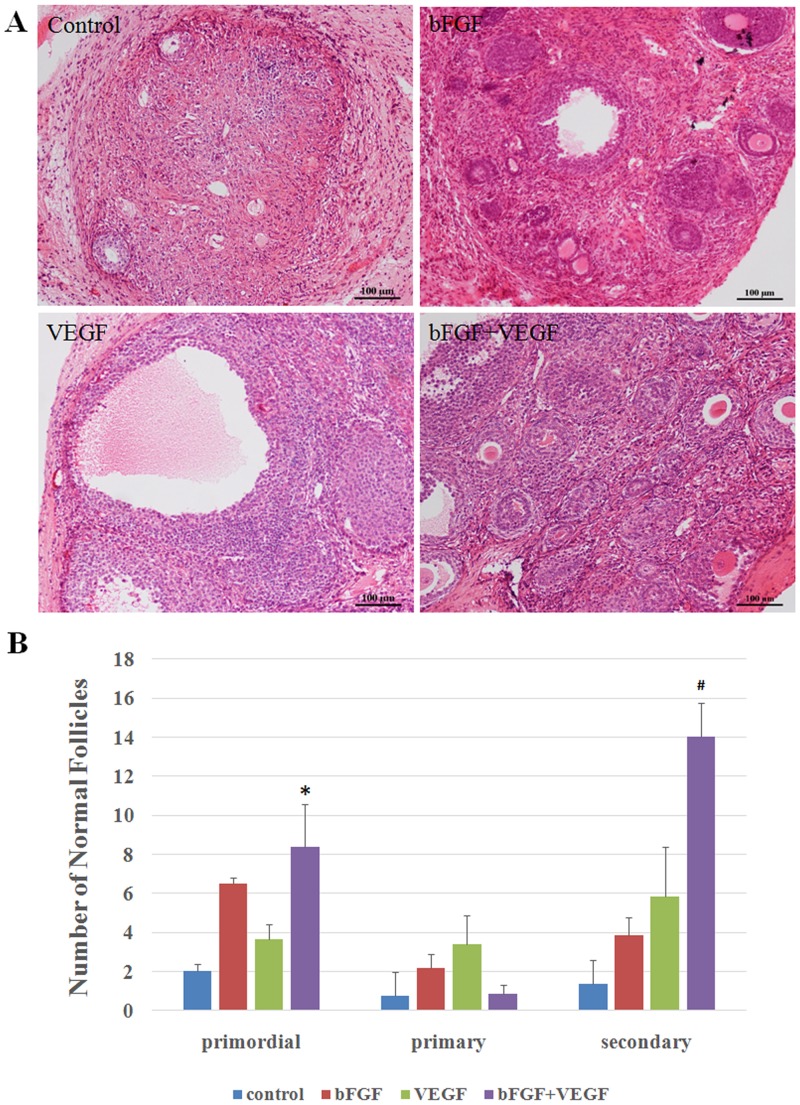
Fig 1. Ovarian tissue morphology after transplantation.
(A) Representative micrograph of H&E-stained ovarian sections showing the preserved follicles. Original magnification100×. Scale bar = 100 μm. (B) The quantity of normal follicles at different developmental stages, including primordial, primary, and secondary follicles. * and # indicate that the p-value was <0.05 compared with the control group for primordial and secondary follicles, respectively.

