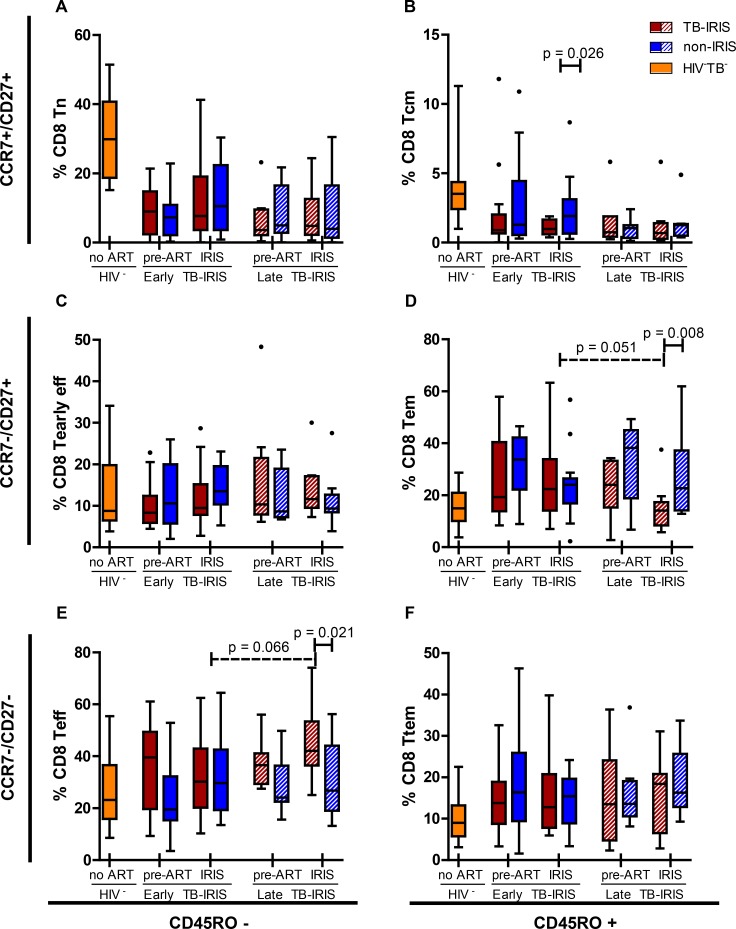
Fig 4. Percentage of CD8+ maturation sub-stages in early-onset TB-IRIS patients.
These box and Tukey whisker plots represent median percentages and IQR of; A, naïve cells (Tn); B, central memory cells (Tcm); C, early effector cells (Tearly eff); D effector memory cells (Tem); E, effector cells (Teff); F, terminal effector memory cells (Ttem) within CD8+ T cells for early- and late-onset TB-IRIS patients (red) and non-IRIS controls (blue), 16 HIV-TB- (yellow) controls. Full lines above indicate significant differences between paired patients (Wilcoxon signed-rank test). Dashed lines above indicate significant differences between unpaired patient groups (Mann-Whitney U test). The level of significance was set to P < 0.05 for all tests. Number of patients (and paired non-IRIS controls) prior to ART were; 17 for early-onset TB-IRIS and 8 for late-onset TB-IRIS. Number of patients (and paired non-IRIS controls) during IRIS event or corresponding non-IRIS control time point were; 16 for early-onset TB-IRIS and 9 for late-onset TB-IRIS.

