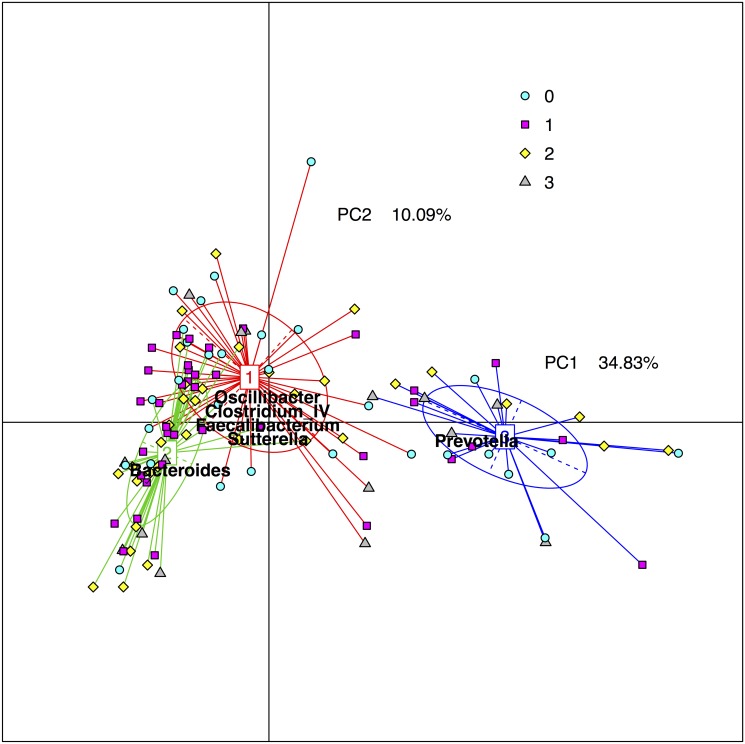
Fig 3. Enterotype groups according to ancestral HLA haplotype AH8.1 status.
The figure shows the individual samples as colored symbols according to their HLA genotype groups (see below) distributed according to similarity of their distribution of bacterial genera in a two-dimensional plot according to the methods by Arumugam et al. [34]. The samples were classified into three fractions, enterotypes, dominated by either Prevotella (blue), Bacteroides (green) or a mix of bacteria (red), where the colored square indicate the centre of the distribution of the enterotype, the straight lines connect the included samples and the colored ellipses cover the individuals near the center of gravity for each cluster (1.5σ). Bacterial taxa overrepresented in the corresponding enterotypes are listed. As evident from the symbol color of the individual dots, the different HLA genotype groups (see below) were not preferentially distributed to one particular enterotype fraction. Yellow diamonds: AH8.1 homozygotes, i.e. homozygosity for both HLA-B*08 and HLA-DRB1*03. Violet squares: AH8.1 heterozygous, i.e. at least 1 copy of HLA-B*08 and HLA-DRB1*03. Turquoise circles: Non AH8.1 heterozygotes, i.e. HLA-B*08 and HLA-DRB1*03 both not present. Grey triangles: HLA-DRB1 homozygotes but non AH8.1.

