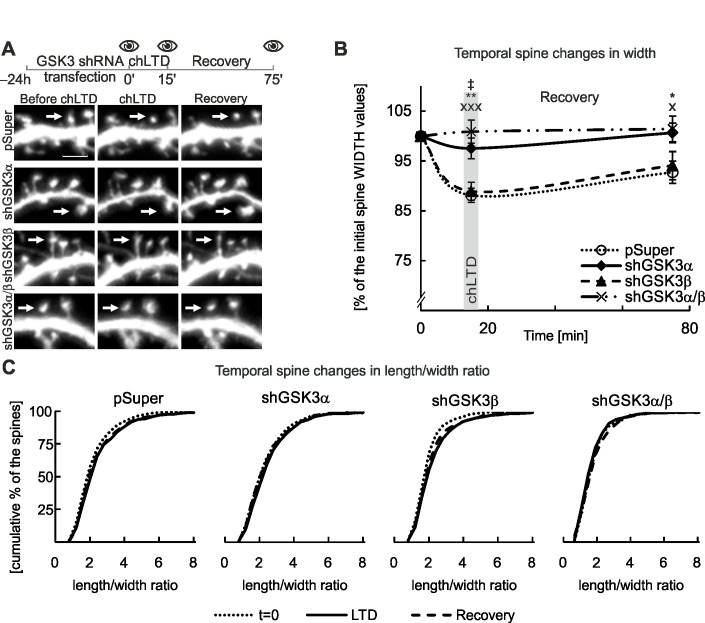
Fig 5. Knockdown of GSK3α but not GSK3β affects chLTD-induced changes to dendritic spine morphology.
A. Experimental outline with 3 time points for microscopy: baseline, chLTD induction, end of recovery period. Representative micrographs of cultured DIV18 murine hippocampal neurons transfected with shRNA constructs as indicated. Scale bar = 2.5 μm. B. Quantitative analysis of spine shape changes; * = p < 0.05, ** = p < 0.01 and x = p <0.05 and xxx = p < 0.001 for measurements of spines after GSK3α and GSK3α/β silencing compared to the control at the corresponding time points. ‡ = p < 0.05 difference between GSK3α and GSK3α/β silencing. For number of counted spines refer to Table 3. Data are presented as the mean spine width per cell ± s.e.m. The curve between time points is extrapolated. C. Spine l/w ratio changes are presented as cumulative histograms of the l/w ratio at 3 time points.

