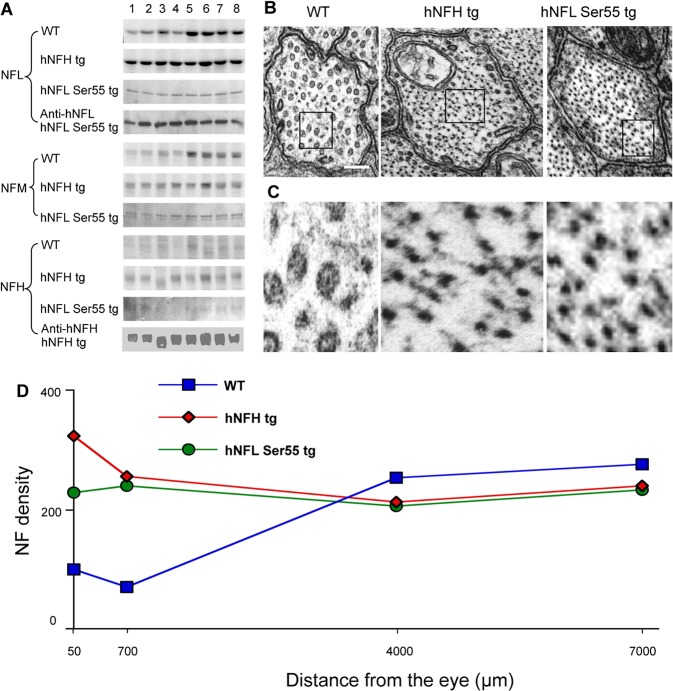
Fig 1. Two genetic mouse models exhibit similar patterns of abnormal axonal NF accumulation.
(A) shows Coomassie Blue-stained gels of NFL, NFM and NFH distribution from 8 segments of optic pathway of WT, hNFH tg and hNFL Ser55 tg mice and also the distributions of hNFH and hNFL recognized by anti-human NFH specific antibody in hNFH tg and anti-human NFL specific antibody in hNFL Ser55 tg, respectively. Cross-sections of axons at the 50μm level of the optic nerve shows increased NF number in hNFH tg and hNFL Ser55 tg mice (B) and higher magnification of marked areas in B (C). Scale bar, 100nm. Average NF density measured in optic axons at levels 50, 700, 4000, and 7000 μm from the retinal excavation in 4 month old hNFH tg, hNFL Ser55 tg and WT mice (D). In each genotype of mice, 996 to 1377 axons in a size distribution matching that of the entire caliber distribution in the optic nerve axons were analyzed.

