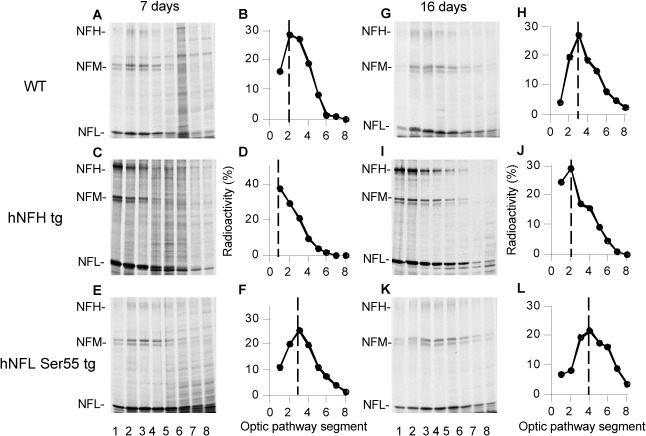
Fig 4. NF transport rates differ in mice exhibiting the same pattern of abnormal NF accumulation along axons.
NF transport rate was determined by intravitreal injection of radiolabeled 35S-methionine into wild-type controls (A-B, G-H), hNFH tg (C-D, I-J) and hNFL Ser55 tg mice (E-F, K-L). At 7 and 16 days after pulse labeling, optic pathways were cut into consecutive 1.1mm segments and fractionated into cytoskeleton and soluble fractions with a Triton X-100–containing buffer. Fractionated proteins were separated on 5–15% SDS-polyacrylamide gels, transferred to nitrocellulose, and visualized by x-ray film and phosphorimaging. (B, D, F, H, J, L) Distributions of NFM were quantified despite nearly identical NF distribution (Fig 1D). NFM transport was significantly slowed in hNFH tg mice (D, J) but not in hNFL Ser 55 tg mice (F, L). Despite marked differences in NF distribution between hNFL Ser 55 tg and WT mice, NF transport in the tg model is unchanged or slightly faster (F, L). NFM peaks are denoted by dashed lines.

