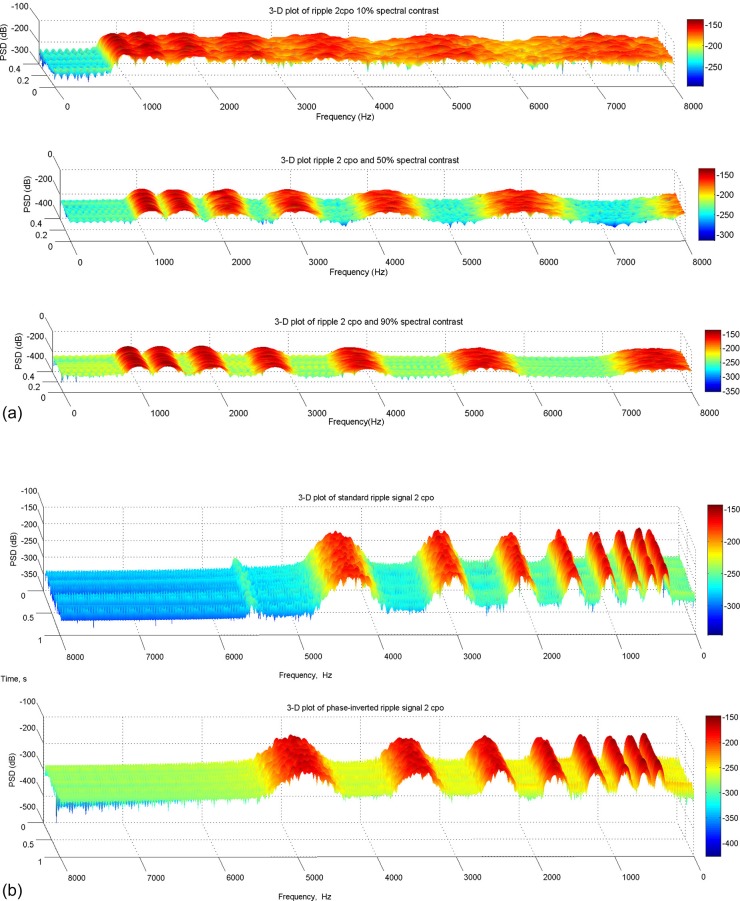
FIG. 2.
(Color online) (a) Illustration of the spectral ripple stimuli used in the modulation detection task. Spectral contrast is illustrated in the different panels. The SMD task measures the smallest spectral contrast that listeners can detect. (b) Illustration of the spectral ripple-phase-inversion task. For example, at 4000 Hz (top panel) the frequency positions of the log-spaced spectral peaks are inverted in the top compared to the bottom panel. The same change in spectral peaks can be seen at 3000 and 2000 Hz when the standard ripple signal (top panel) is compared with the phase-inverted signal (bottom panel).

