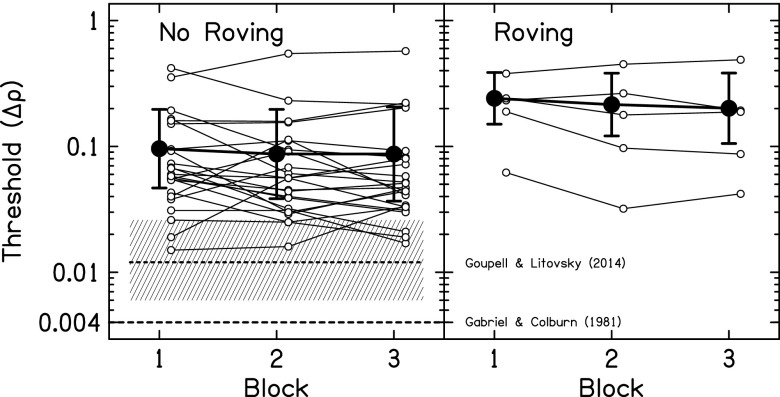
Fig. 1.
ICC thresholds for the 500-Hz CF conditions for three testing blocks. The left panel shows performance when diotic level roving was absent and the right panel shows when roving was present. The average (solid circles) and the individual (open circles) thresholds are shown. The dashed line represents average performance from two experienced listeners in Gabriel and Colburn (1981). The shaded region shows the average ±1 standard deviation from nine listeners in Goupell and Litovsky (2014).

