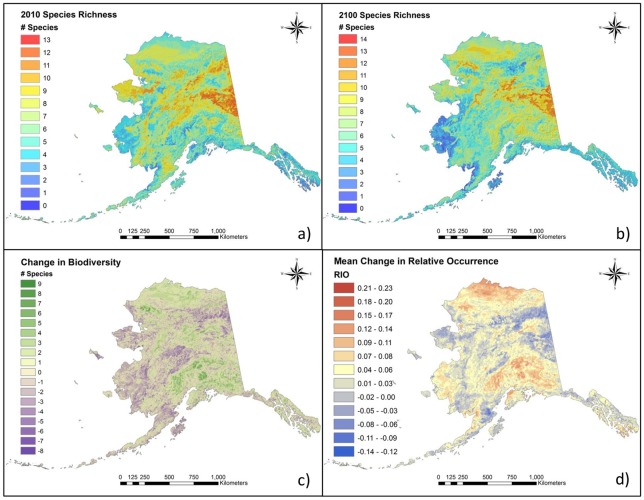
Fig 4. Species richness change maps.
Predictive species richness maps based on composites of binary (presence/absence) maps for 17 species of small mammals for the years a) 2010 (modified from [39]; S1 File) and b) 2100. Maps also depict net change in c) species richness (ΔBio) and d) relative indices of occurrence (ΔRIO). Warm colors indicate net gains in RIO (relative index of occurrence) and species richness, whereas cool colors indicate net loss of RIO and species richness.

