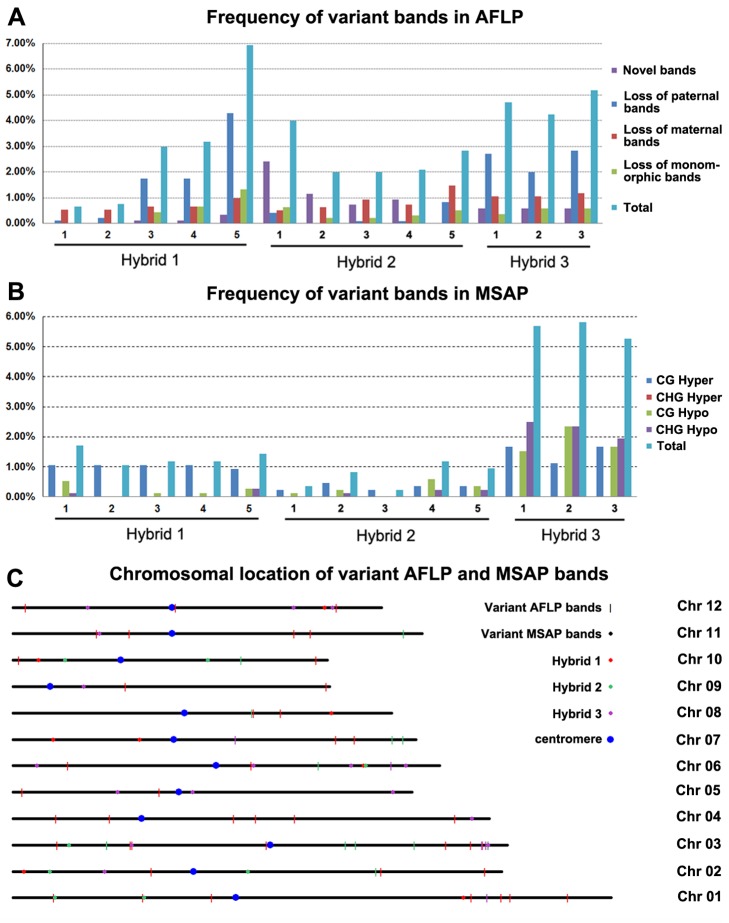
Fig 2. Frequencies and chromosomal location of genetic and DNA methylation changes detected by AFLP and MSAP.
(A) Frequencies of genetic changes detected by AFLP analysis and revealed by various patterns of variant bands in the three F1 hybrids. (B) Frequencies of DNA methylation changes detected by MSAP analysis and revealed by various patterns of cytosine methylation in the three F1 hybrids. In both (A) and (B), the variant bands in the hybrids were determined by comparison with the parental mix. (C) Chromosomal location of the variant AFLP and MSAP bands. The three colors (red, green and purple) denote origins of variant bands from Hybrid 1, Hybrid 2 and Hybrid 3, respectively.

