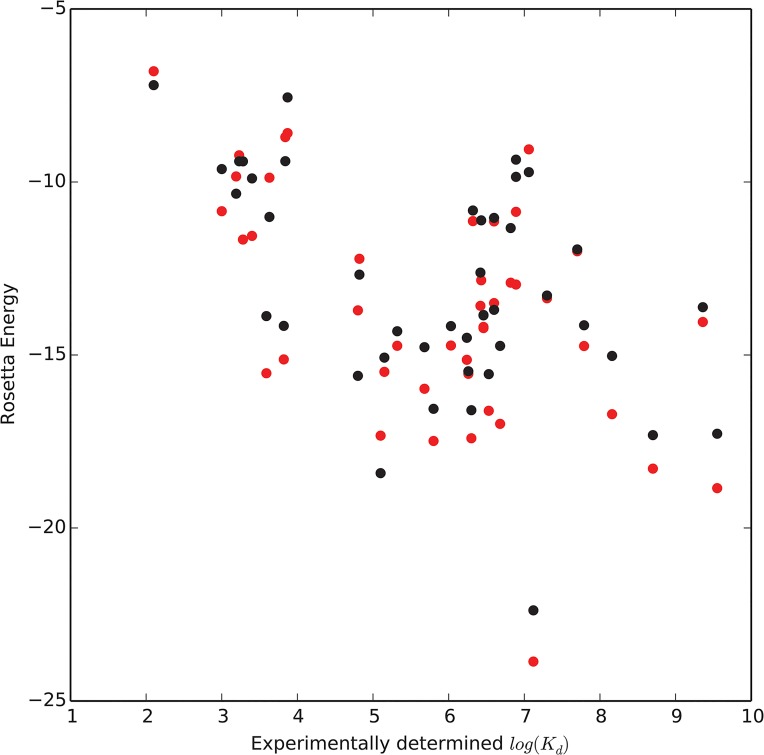
Fig 8. Scatter plots showing the weak correlation between experimental-log(Kd) and predicted Rosetta energy score for models in the 43 protein benchmark.
Scores from models generated using the Transform/MCM protocol are in red while scores from models generated using the Transform/MCM protocol are in black.

