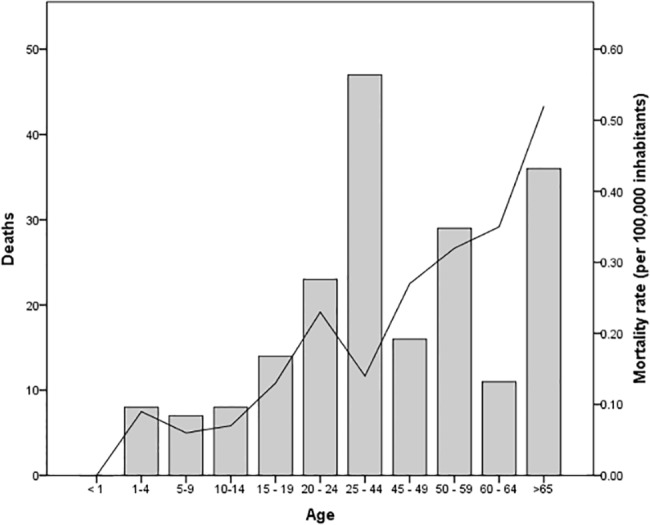
Fig 5. Specific mortality rates and case fatality ratio of leptospirosis according to age.

The bars represent number of patient deaths and solid line represents specific mortality rates (per 100,000 inhabitants) registered during the decade.

The bars represent number of patient deaths and solid line represents specific mortality rates (per 100,000 inhabitants) registered during the decade.