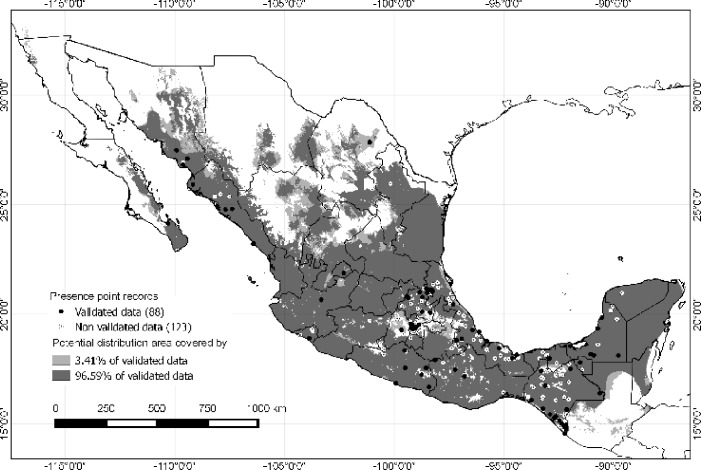
Fig 6. Map showing presence of cases and potential distribution of leptospirosis in Mexico.
The potential distribution was created with ecological niche modeling using validated cases. Dark points show localities of validated data (confirmed leptospirosis cases and deaths), light points show non-validated data (probable cases and deaths that were pooled together due to the unknown status of the patients). Grey tones show the two thresholds used to determine the potential distribution of the disease. Dark grey shows the threshold of 96.59% of the best subsets. Light grey shows the remaining 3.41% of the validated data considered as possible errors.

