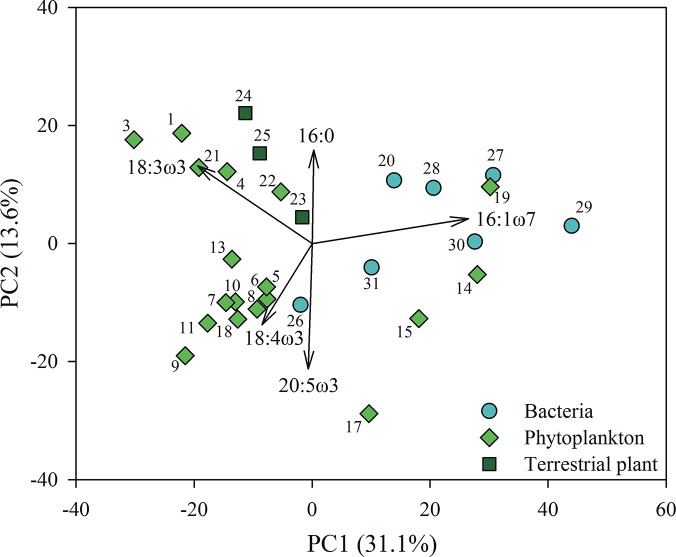
Fig 1. Fatty acid profiles of phytoplankton, bacteria and terrestrial plants.
Principal component analysis (PCA) of the fatty acid composition of the phytoplankton, bacteria and terrestrial plants. Proportion of explained variance is in parentheses. PCA was run with all 67 fatty acids, but only eigenvectors > 0.3 are shown.

