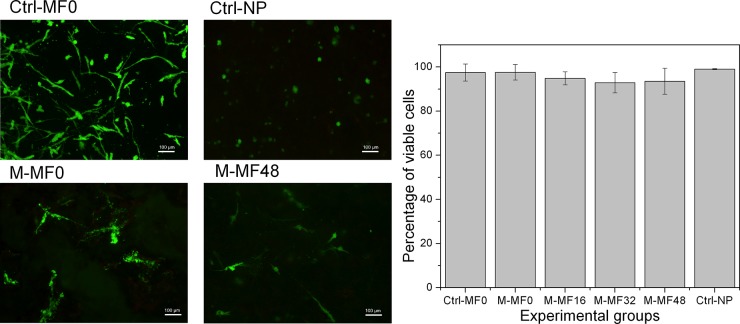
Fig 2. Cell viability tests.
Fluorescence microscopy images (scale bar: 100 μm) representative of each experimental group. Live cells are stained green, and dead cells red. The graph shows the mean values ± standard deviations for live cells from 8 independent experiments for each experimental group. Ctrl-MF0: control (nonmagnetic) tissue substitute without particles, gelled in the absence of a magnetic field; Ctrl-NP: control (nonmagnetic) tissue substitute with nonmagnetic polymer particles; M-MF0: magnetic tissue substitute gelled in the absence of a magnetic field; M-MF16, M-MF32 and M-MF48: magnetic tissue substitutes gelled during application of a 16 kA m-1, 32 kA m-1 or 48 kA m-1 field, respectively.

