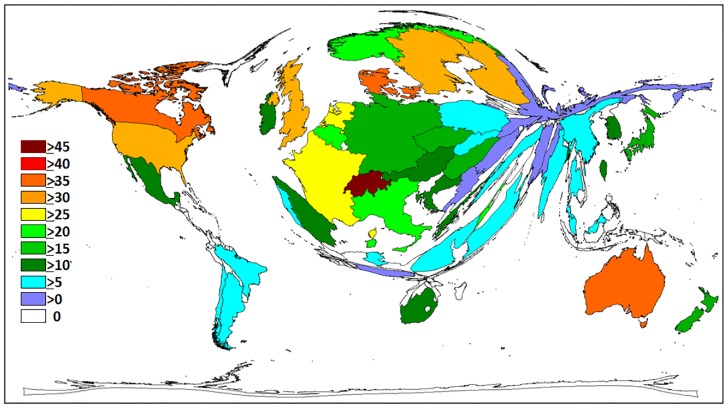
Fig 3. Density equalizing mapping, average number of citations per T2DM related item by country.
The size of each country is scaled in proportion to the average number of citations per item. The colour coded legend shows the average number of citations per item. Threshold excludes countries with ≥30 items published.

