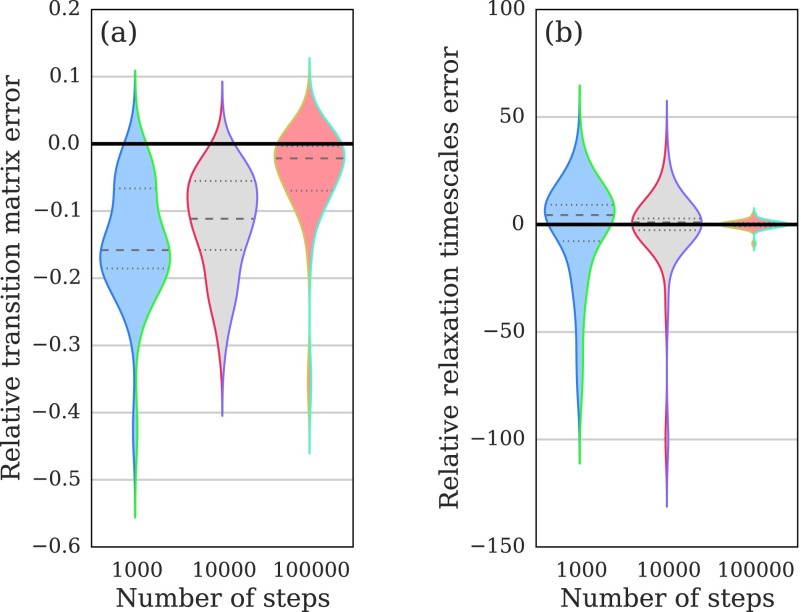
FIG. 6.
Violin plots of the relative error between continuous-time and discrete-time Markov models for kinetics on random graphs. Values below zero indicate lower error for the continuous-time model, whereas values above zero indicate the reverse. The shape displays the data density, computed with a Gaussian kernel density estimator. Panel (a): as measured by the Frobenius-norm error in the estimated transition matrices, , the continuous-time model achieves lower errors, with a larger advantage for shorter trajectories. Panel (b): as measured by the max-norm error in the estimated relaxation time scales, , the two models are not distinguishable.

