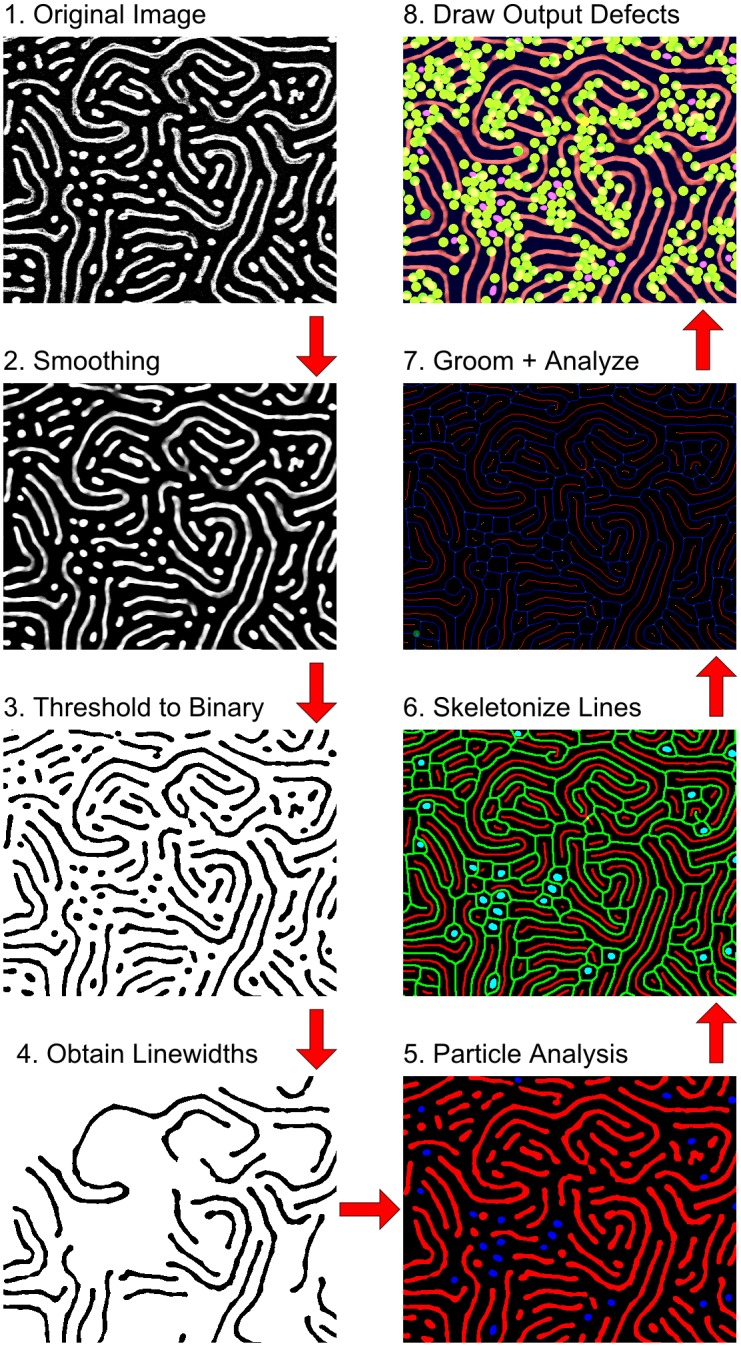
Fig 2. A brief visual outline of the analysis undertaken by the ADAblock application, broken into 8 major stages in sequential order.

(1) The original SEM image; (2) Smoothing of the image to reduce noise; (3) Thresholding the image to produce a binary image suitable for particle analysis; (4) Analysis of period and line-widths in order to set parameters in subsequent analyses; (5) Particle analysis of the binary image to find lines and dots; (6) Skeletonization of the lines; (7) Grooming and analysis of the skeletons; and (8) Compiling visual and other data files for output.
