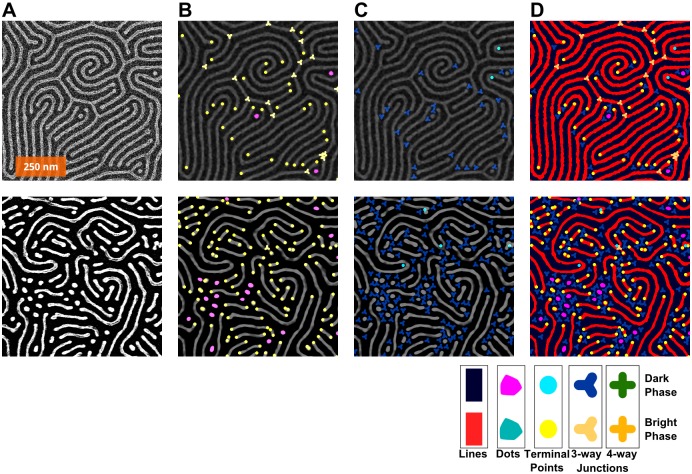
Fig 5. How the defects, depending on phase (bright = “positive”; dark = “negative”), tend to be of different types.
Analysis of two images are shown in parallel with corresponding images in two columns. (A) The original images. (B) Defects in the positive phase marked. (C) Defects in the negative phase marked. (D) All defects. Legend at the bottom shows colours and shapes used for each feature: Bright phase: red lines, teal dots, yellow circles at terminal points, and 3- and 4-connected junctions. Dark phase: navy blue lines, magenta dots, aqua terminal points, and 3- and 4-connected junctions represented by shapes with an equal number of branches.

