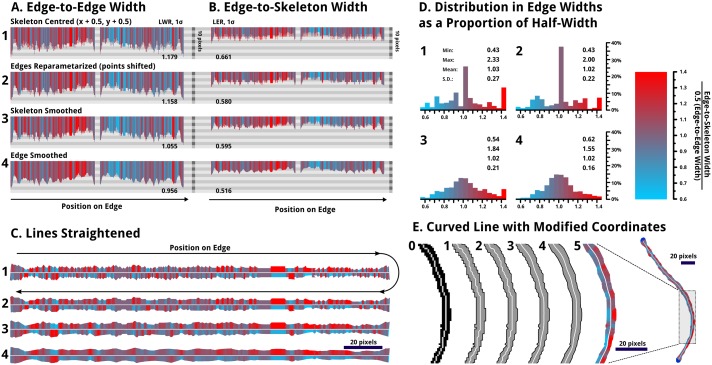
Fig 11. The smoothing process used to partially eliminate roughness resulting from pixelation of the lines.
The labels 1, 2, 3, and 4 mark the line subject to each of the four stages of smoothing described. All images with the cyan-to-red colour scheme show the relative width of the opposite side of the line, from the skeleton centre, to the edge; if a side is wider in proportion it is shown in red; narrower is shown in cyan. A colour scale is given provided. (A) The top left shows the edge-to-edge width, following both sides of the edge of the line (C1), hence it is roughly symmetric; (B) the edge-to-skeleton widths are plotted similarly, but with roughly half of the displacement. (C) Next, the lines are shown replotted in a straightened fashion. Note that the lengths have been scaled to be equal, as smoothing of the skeleton shortens the length measured along the skeleton, as expected, due to smaller point-to-point displacements. In the above 3 cases, the more smoothed lines show smaller variations in colour. (D) The histograms represent the edge to skeleton widths relative to the half widths for each point. € Last, the original skeleton (0), along with the 4 stages of smoothing (1,2,3,4) are shown for a re-drawn line, along with a the distribution of edge widths via colouration (5).

