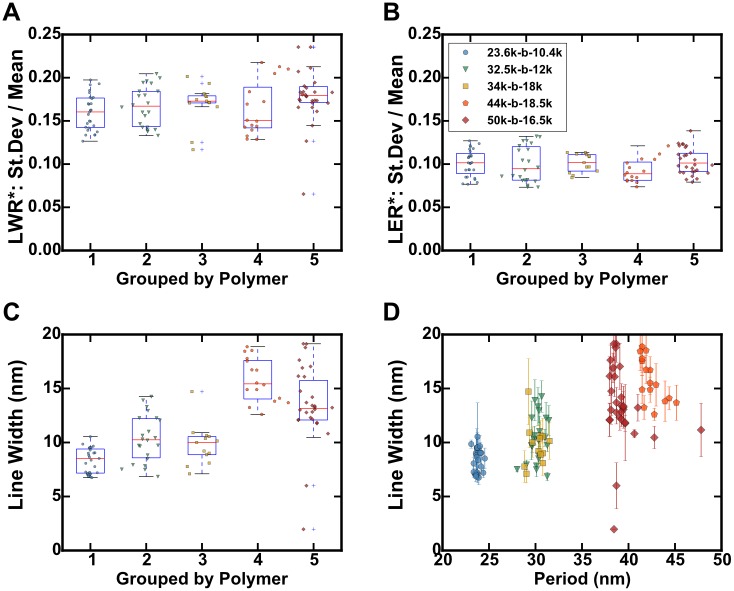
Fig 16. Boxplots of calculated BCP pattern metrics for SEM images with various resolutions for 5 cylinder-forming PS-b-P2VP block copolymers, each identically treated.
Data from all resolutions shown. Data from individual images are shown with dark markers. A. Boxplot of the standard deviation for line-width (LWR, 1σ) divided by the line-width for various resolutions, grouped by polymer. B. Boxplot of the standard deviation for line edge position (LER, 1σ) divided by the line-width for various resolutions, grouped by polymer. C. Boxplot of measured line-widths for polymer groups by polymer. D. Same data, plotted as a function of BCP period (nm), all resolutions included; the error bars are standard deviations for the line-widths from measuring the lines separately.

