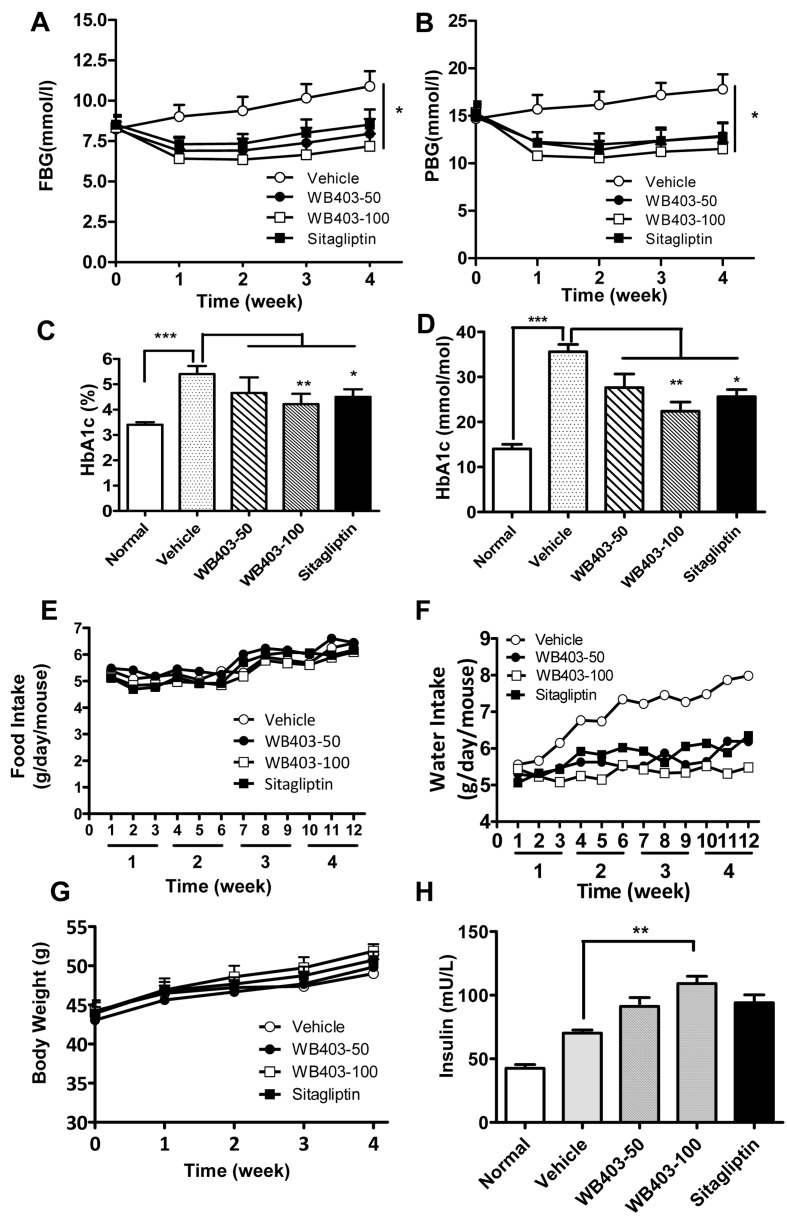
Fig 3. Effects of WB403 treatment in db/db mice.
(A, B) FBG and PBG measured every week during the 4-week treatment period. (C, D) Serum levels of HbA1c, measured at the end of intervention by Adicon Clinical Laboratories (Shanghai, China) using an immunoturbidimetric assay on Beckman AU680 biochemical analyzer. (E) Average daily food intake per mouse during the treatment period. Data was collected three times per week. (F) Average daily water intake per mouse. (G) Body weight from different groups of mice. (H) Serum levels of insulin were measured at the end of intervention. Values are mean ± SEM (n = 5). *p<0.05, **p<0.01, ***p<0.001 vs. vehicle group.

