
Fig 2. Schematic diagrams showing the experimental designs to exclude livestock and reduce pikas.
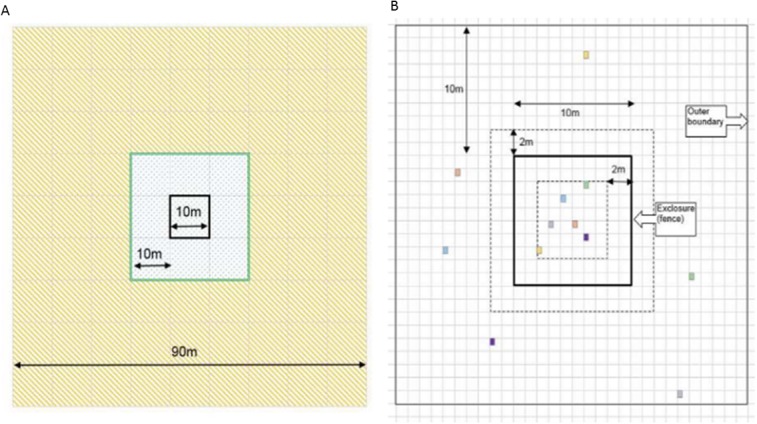
A. Experimental design, showing the fence (solid black line), the area within which paired, non-exclosure plots were located (wide green line), and the 30 m extending beyond the experiment on each side (orange-hatching) within which pikas were reduced by snap-trapping during 2010–2013, Gouli Township, Qinghai Province, China. B. Schematic of exclosure experiment, showing typical placement of 12 vegetation plots established in September 2009, Village Five, Gouli Township, Qinghai Province, China. Bold solid line represents the 100 m2 livestock exclusion fence. Within the inner 64 m2 of the exclosure (dashed line), 6 vegetation plots (0.5 m2 each; colored squares) were randomly distributed (see text). Six paired vegetation plots that were similar in vegetation composition and density to each of the random plots (colors represent pairing) were selected within the area extending 10m in each direction from (but not within 2 m, dashed-line, of) the exclusion fence.