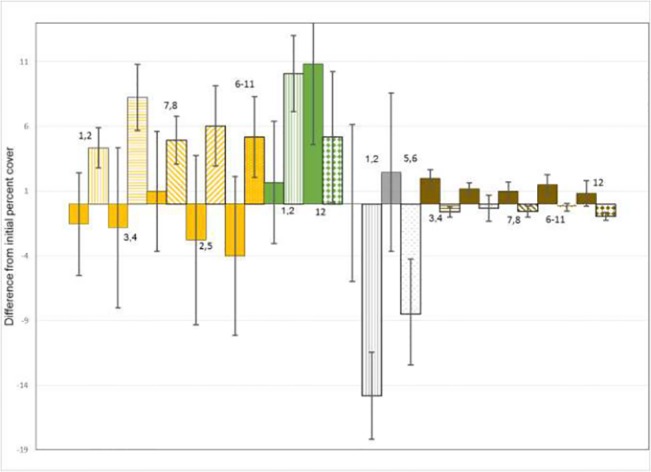
Fig 4. Histograms showing effects of livestock exclosure on biophysical variables in experiments where significant (P < 0.025).

Shown are mean and 95% confidence intervals (error bars) for exclosure-caused differences in percent plot covered by litter (orange), live vegetation (dark green), erosion index (gray), and bare soil (brown). Values prior to livestock exclosure indicated by solid shading, values after livestock exclosure indicated by vertical hatching (experiments 1 and 2), horizontal hatching (experiments 3 and 4), sparse points (experiments 5 and 6), diagonal upper left to lower right hatching (experiments 7 and 8), diagonal upper right to lower left hatching (experiments 2 and 5), reverse color sparse points (experiments 6 through 11), bricks (experiment 9), and diamonds (experiment 12).
