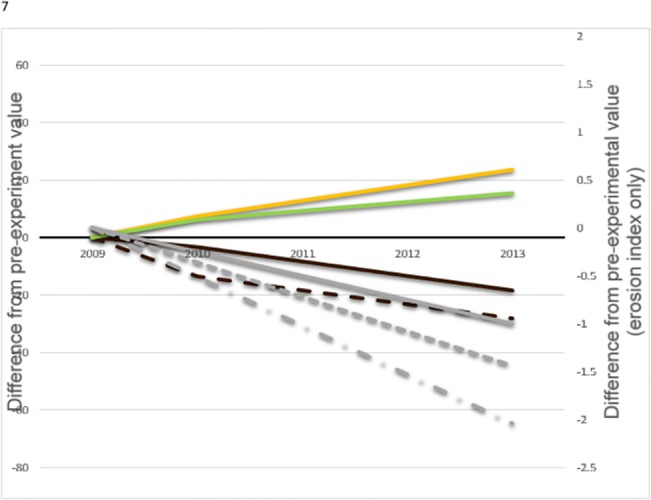
Fig 5. Trends on time, showing effects of livestock exclosure on biophysical variables where significant (P < 0.025).

Shown are mean differences between within and outside livestock exclosure fences of litter (orange), live vegetation (dark green), bare soil (brown), and erosion index (gray), with all values calibrated to zero difference in 2009, the year exclosures were established. Individual experiments are indicated by solid (experiments 1 and 3), dashed (experiments 5 and 6), and dash-dot (experiment 3) lines.
