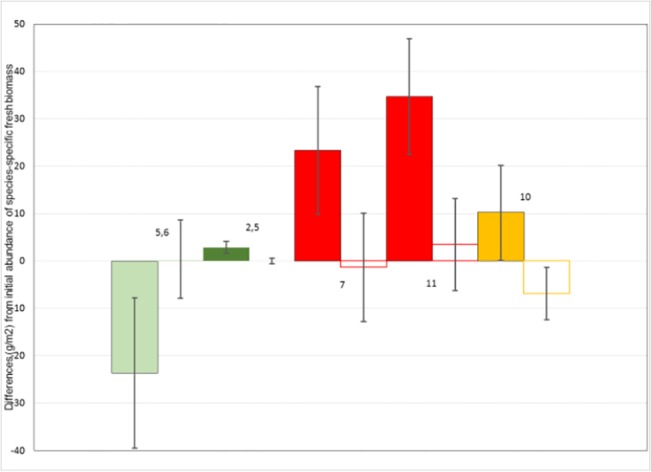
Fig 6. Histograms showing effects of livestock exclosure on vegetation in experiments where significant (P < 0.025).

Shown are mean and 95% confidence intervals (error bars) for exclosure-caused differences in fresh biomass (g/m2) of Stipa purpurea (light green), Kobresia (dark green), Heteropappus altaicus (red), and Cardamine tangutorum (orange). Values prior to livestock exclosure indicated by solid shading, values after livestock exclosure indicated by open bars (experiments indicated adjacent to bar pairs).
