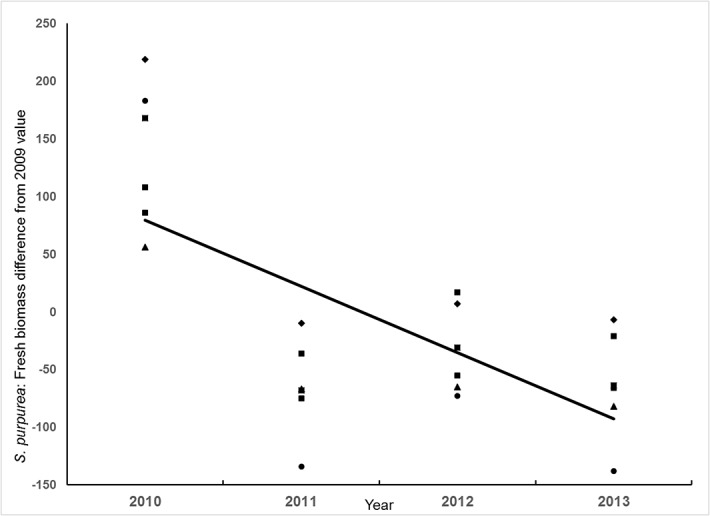
Fig 8. Mixed-effect linear model showing the pattern of paired-plot differences in Stipa purpurea fresh biomass in experiment 2.

Raw data are scaled so that paired-plot differences in the baseline year 2009 were all set to zero, and vegetation plots (n = 6, solid circles) were treated as random effects. Y-axis scale is paired-plot differences in g/0.5 m2. Values in 2010 (year 0) were significantly greater than zero (P = 0.0045; greater annual production of S. purpurea above-ground biomass within than outside the exclosure), but the dynamic reversed beginning in 2011 (β = -114.56 g/m2/yr, P = 0.0005).
