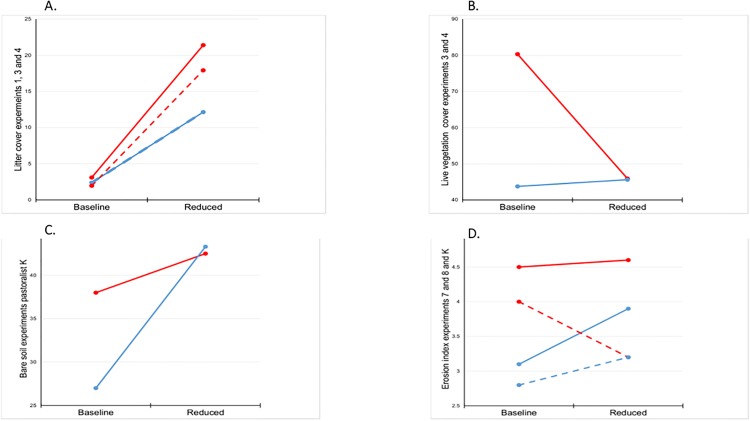
Fig 9. Patterns of biophysical variables where differences among comparable experiments were attributable to reductions in pika abundance (P < 0.025).
Trends indicated by red lines are mean values from experiments in which pikas were reduced; blue lines from control experiments. A) litter cover, paired experiments 3 and 4 (solid lines), and experiments from pastoralist K (dashed lines); B) percent cover consisting of live vegetation, experiments 3 and 4; C) percent bare soil, experiments 1, 3, and 4; and D) erosion index, experiments 7 and 8 (solid lines), and experiments 1, 3, and 4 (dashed lines).

