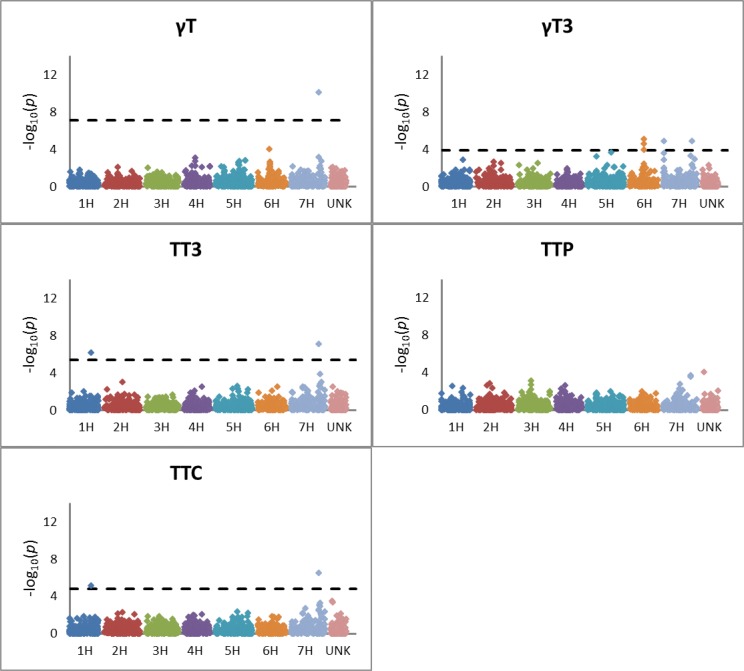
Fig 3. Manhattan plots showing results of GWAS for concentrations of γT, γT3, TT3, TTP, and TTC.
In analyses where one or more markers met the significance threshold determined by a false-discovery rate adjustment, a dotted line shows the significance threshold. Points in pink, adjacent to chromosome 7H, represent unmapped markers.

