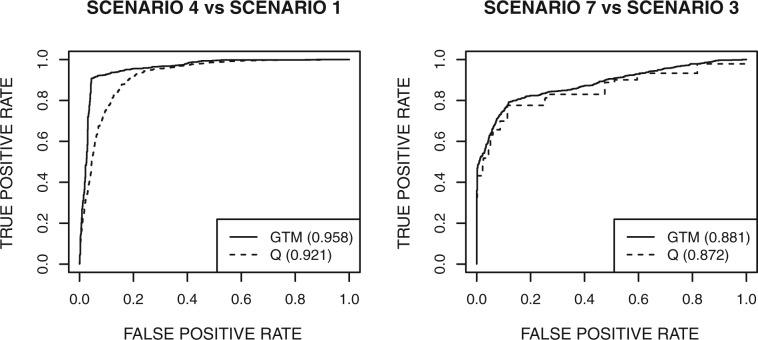
Fig 3.
ROC curves for detecting heterogeneity using GTM and Q-statistic on simulated datasets. Left: scenario 1 (homogeneity) versus scenario 4 (heterogeneity). Right: scenario 3 (homogeneity) versus scenario 7 (heterogeneity). Parameters are T = 30 tissues and n = 10 reads per tissue. Heterogeneity statistics are the posterior probability of HET0+HET1 from GTM and the empirical P-value from the Q-statistic. The legends show percent concordance measures for the ROC curves

