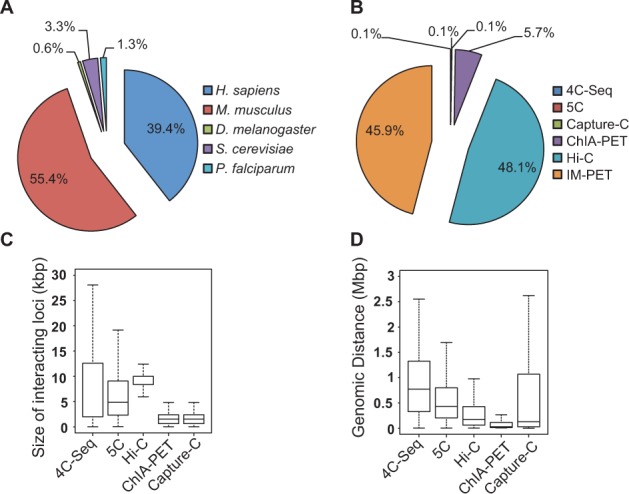
Fig. 1.

Content of 4DGenome and general characteristics of database records. (A) Percentage of interactions by organism. (B) Percentage of interactions by detection method. Interactions detected by 3C are not included in the pie chart because its percentage is too small to show. (C) Resolution of interactions. Shown are the sizes of interacting genomic regions by various methods. (D) Distribution of linear genomic distance between interacting regions. Distance is computed as the center-to-center distance between two interactors
