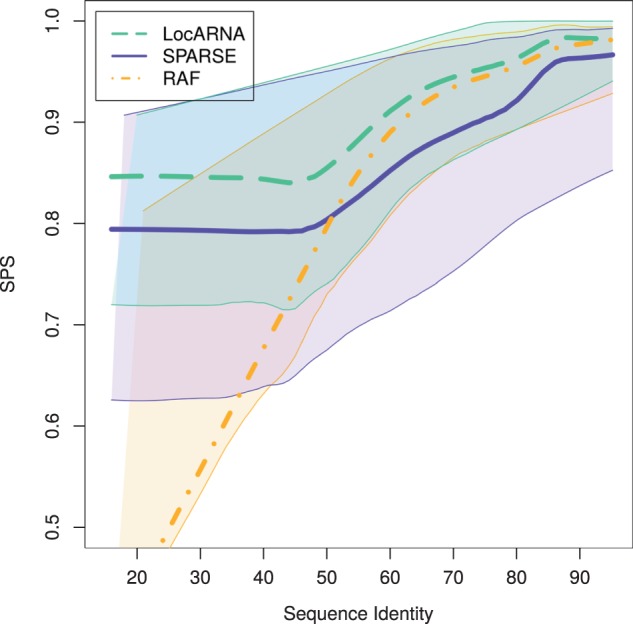
Fig. 4.

Alignment quality (measured by SPS) at different sequence identities for pairwise alignments (Bralibase 2.1 set k2). The curves are lowess curves (Cleveland, 1981) through data points for each benchmark instance. The thin lines visualize the distribution of scores by estimating the respective instance averages above and below of the main lowess curve
