
Fig. 3.
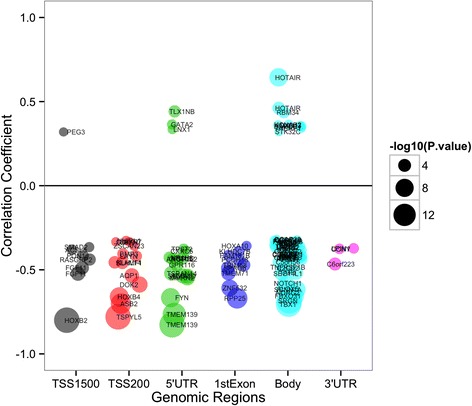
Genes whose expression levels correlated with methylation level of progression-related CpGs from Stage I ER positive TCGA breast tumors. Bubble points represent genes that demonstrate a significant relationship between methylation of a CpG and expression of its nearby gene in a genomic-context dependent manner. Increasing bubble diameter corresponds with decreasing P value. CpG position relative to gene location is plotted versus correlation coefficient between CpG methylation and gene expression