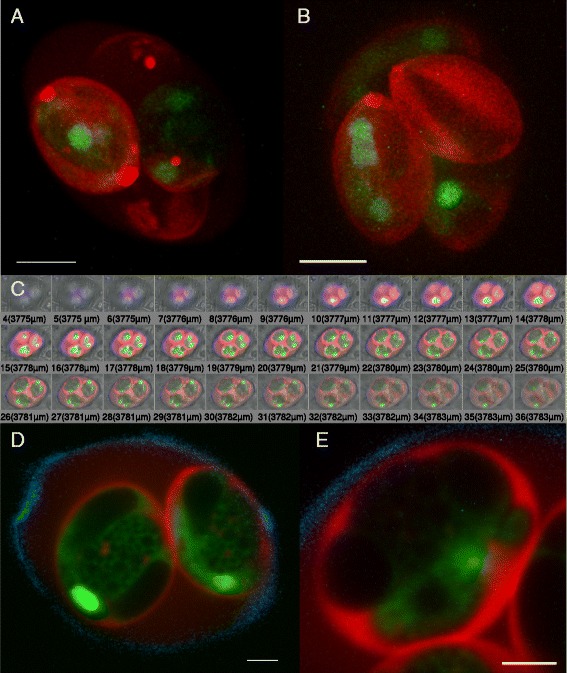
Fig. 7.

Confocal Microscopy of sporulated EnOWP2-mCherry-oocyst. a: 3D reconstruction of optical sections through an EnOWP2-mCherry oocyst (red and green channel). The mCherry signals are distributed at the sporocyst wall around the cytoplasmatic YFP signal. More intense signals are localised at both polar ends of the sporocyst. Note, that all sporocysts harbour the red mCherry signal, whereas YFP is only expressed within two sporocysts (see also Additional file 5). Scale bar 5 μm. b: oocyst with mCherry signal in all sporocyst but YFP in 3 sporocysts. More intense mCherry signals are visible at the Stieda body region (see also Additional file 6) Scale bar 5 μm. c: Selection of optical sections of representing fluorescence signal through the half of an oocyst. d: Optical section through the middle of an oocyst (overlay of mCherry, YFP and UV autofluorescence). The mCherry signals are localised at the sporocyst wall, few vesicle shaped signals in the sporocyst residuum and also less mCherry signals in the circumplasm (see also Additional file 9) Scale bar 2 μm. The YFP is distributed to the sporozoites within the sporocysts. e. Optical section through an oocyst and close up of a single sporocyst (overlay of mCherry, YFP and UV autofluorescence). Strong mCherry signals separating the sporocyst from the circumplasm. Within the sporocyst the red mCherry signals embed the sporozoites, indicated by the green YFP signals. Scale bar 1.5 μm
