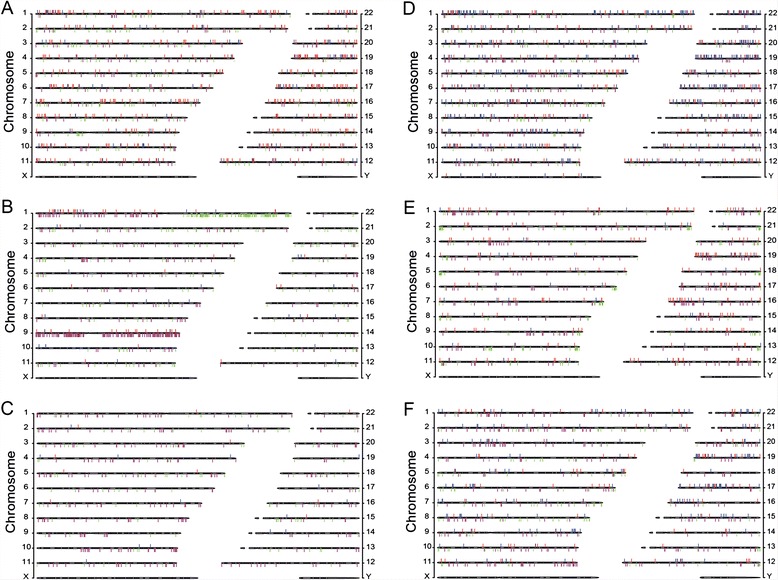
Fig. 1.

Chromosomal distributions of mutations in individual AluScan samples. LOHs (red bars) and GOHs (blue bars) detected from the AluScans of each tumor-control pair are plotted above the cytobands, and CN-gains (green bars) and CN-losses (purple bars) plotted below the cytobands, for six representative cancer samples. a Gastric 1, b Glioma 1, c Leukemia 1, d Liver 1, e Lung 1, and f Lung-Brain 1. Similar distributions for another twenty-four cancers are shown in Additional file 6: Figure S1. Complete listings of LOHs, GOHs and CNV sites in all thirty cancer samples, and comparison of the detected CNVs with those in the TCGA database [60] are given in Additional files 7: Table S4, Additional file 8: Table S5, Additional file 5: Table S6, respectively. Clinical information on each patient is indicated in the footnotes to Additional file 1: Table S2
