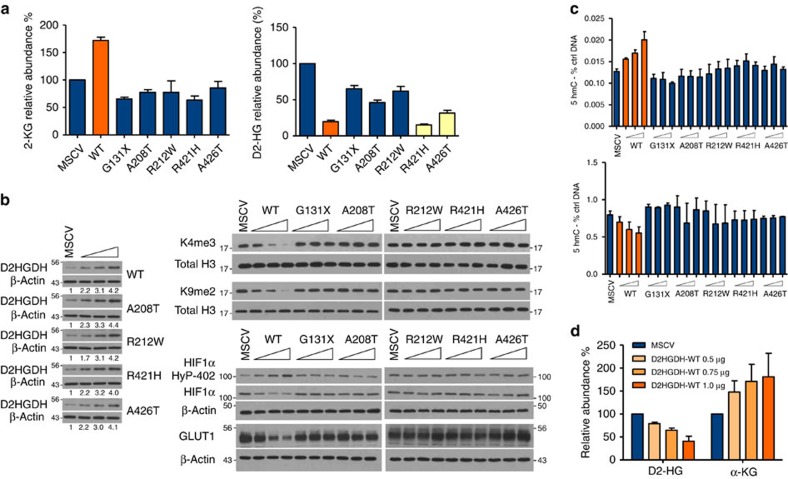
Figure 2. D2HGDH modulates D2-HG and α-KG levels and the readout of dioxygenases function.
(a) Left: LC/MS show that WT-D2HGDH cells have significantly higher α-KG levels than empty-MSCV or mutant D2HGDH expressing isogenic cells (P<0.0001, ANOVA; P<0.05 Bonferroni's multiple comparison post test). Right: expression of WT D2HGDH significantly lowered D2-HG levels in comparison with cells expressing and empty-MSCV or the G131X, A208T and R212W mutants, but not R421H or A426T (yellow bars) (P<0.0001, ANOVA). (b) Left: western blots of D2HGDH in cells transiently transfected with an empty vector (MSCV—1 μg) or increasing amounts (0.5 μg, 0.75 μg and 1 μg) of the WT or mutant enzymes—densitometric quantification confirms the progressive elevation of D2HGDH levels. Right top: western blots of H3K4me3 and H3K9me2 show a progressive decrease in methylation in cells expressing the WT D2HGDH but not the mutant enzymes; right bottom: in hypoxia, expression of WT D2HGDH increases HIF1α hydroxylation (Pro-402), with decrease in its stability, and expression of the transcriptional target GLUT1; expression of mutant enzymes has no effects on HIF1α hydroxylation/expression. (c) WT-D2HGDH cells display a significantly higher abundance of 5hmC marks (top panel, P<0.0001, ANOVA) and concomitant decrease in global DNA methylation (bottom panel, P=0.035, ANOVA). Expression of mutant D2HGDH did not significantly influence 5hmC or 5mC levels. (d) Transient expression of WT D2HGDH significantly decreased D2-HG and increased α-KG levels in a dose-dependent manner (P=0.006 and P=0.0002, respectively, ANOVA). The data shown in a represent the mean and s.d. of assays performed with four or five replicates per sample type, and displayed as relative levels to control cells (MSCV). The transient transfection assays (b–d) were performed three to four times. The data shown in c represent mean and s.d. of five data points derived from two biological replicates. The data shown in d represent the mean and s.d. of an assay performed in triplicate, displayed as relative levels to control cells (MSCV); the result from an independent biological replicate is shown in Supplementary Fig. 6.

