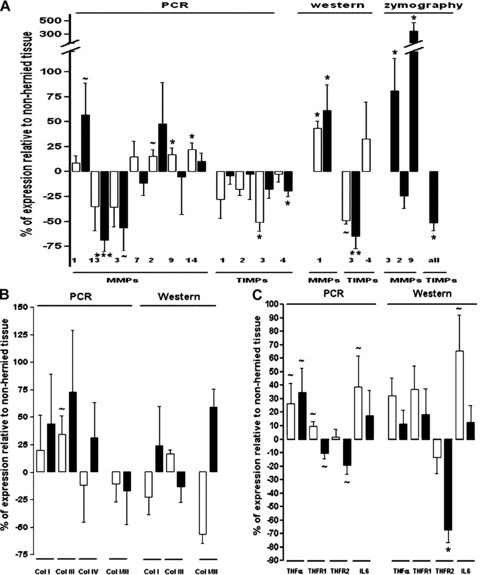
Figure 2.

Representative RT-PCR, Western blot and zymography analyses obtained in incisional hernia and control tissues. (A) MMPs and TIMPs, (B) collagens (types I, III and IV) and type I to type III collagen ratios and (C) inflammatory mediators (TNFA, TNFRSF1A, TNFRSF1B and IL-6). Results are displayed graphically using percentages of change of each molecule (incisional hernia versus non-incisional hernia controls) to facilitate the interpretation of the results. Only detectable results are represented. ∼P value 0.05– 0.10, *P value 0.05–0.01, **P value 0.01–0.001, ***P value < 0.001. ▪, aponeurosis; □, skeletal muscle.
