
Figure 3.
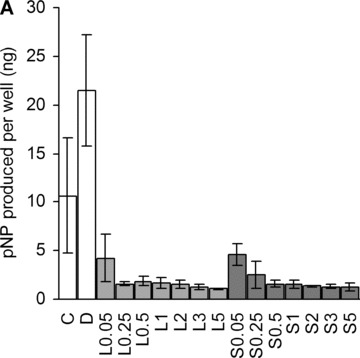
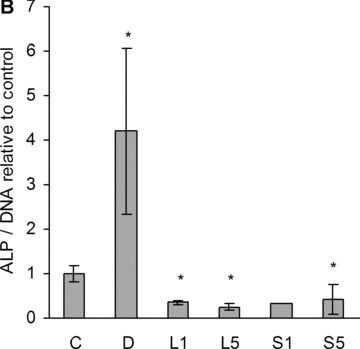
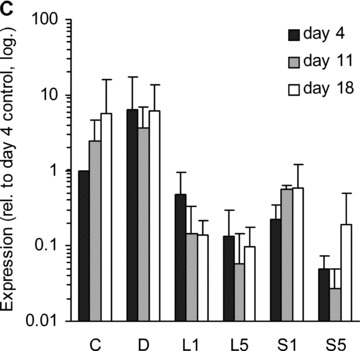
Alkaline phosphatase. (A) Dose-dependent suppression of ALP activity by statins at day 18. C, non-induced control; D, dexa; L, lovastatin; S, simvastatin. The numbers next to letters represent concentrations in μM. 1 donor, the error bars show S.D. of triplicates (experimental error). (B) ALP activity was measured with a para-nitrophenylphosphate assay at day 11. The amount of product was normalized to DNA, and compared with the activity of the non-induced control. C, non-induced control; D, dexa; L1, 1 μM lovastatin; L5, 5 μM lovastatin; S1, 1 μM simvastatin; S5, 5 μM simvastatin. The error bars represent ±1 S.D. The data are triplicates from 1 to 6 donors (n= 1 in case of S1). *P < 0.05 compared with non-induced control. (C) Relative amount of tissue independent ALP mRNA in different treatment groups at three time-points (distinguished by greyscale shading). C, non-induced control; D, dexa; L1, 1 μM lovastatin; L5, 5 μM lovastatin; S1, 1 μM simvastatin; S5, 5 μM simvastatin. Each bar represents a mean value of 2–6 experiments (n= 2–6). All values are relative to day 4 non-induced control of the respective experiment, and are plotted on a logarithmic scale. The error bars span 1 S.D.