
Figure 4.
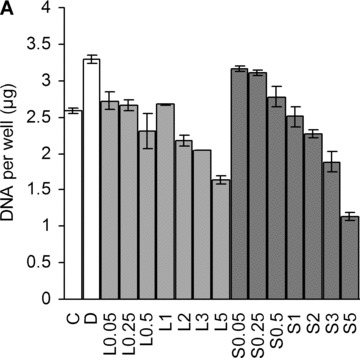
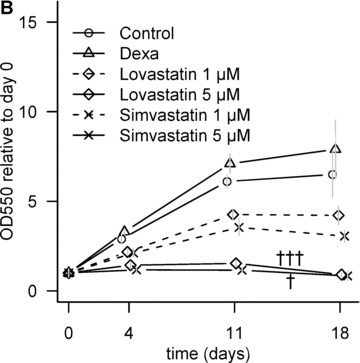
Effect of statins on cell number. (A) Dose-dependent decrease in cell number at day 18. C, non-induced control; D, dexa; L, lovastatin; S, simvastatin. The numbers next to letters represent concentrations in μM. 1 donor, the error bars show S.D. of triplicates (experimental error). (B) Relative metabolic activity determined by MTT assay at different time-points. All values are compared to day 0. The grey error bars represent standard deviation of triplicate samples from 2 donors. †P < 0.05 between day 11 and day 18 of the same treatment; †††P < 0.001 between day 11 and day 18 of the same treatment.