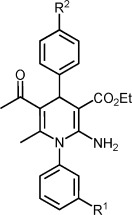
Table 2.
Initial shift from core bicyclic to monocyclic 2-amino-1,4-dihydropyridine systems: northern and southern SAR.
 | |||||
|---|---|---|---|---|---|
| Compd | R1 | R2 | HNE IC50 [nm][a] | Fmax [%][b] | CYP 2C9/3A4 IC50 [μm][c] |
| 7 | NO2 | Br | 200 | 15 | –/– |
| 8 | CF3 | Br | 200 | 31 | 0.6/0.5 |
| 9 | CF3 | CN | 20 | 57 | 0.5/25 |
The inhibitory capacity of test compounds was assessed by applying functional biochemical assays with the isolated enzyme (Supporting Information); IC50 values were derived from enzyme activity data (pH 7.4) in the presence/absence of various compound concentrations by applying a suitable fluorogenic peptide substrate, MeOSuc-AAPV-AMC.
The metabolic stability of test compounds was assessed in the presence of rat hepatocytes by determination of the half-life of the compound (Supporting Information). Clearance parameters and Fmax values were calculated from this half-life, representing a measure of the phase 1 and phase 2 metabolism.
The potency of test compounds to inhibit human CYP 2C9 and CYP 3A4 was investigated with pooled human liver microsomes as enzyme source and selective standard substrates (Supporting Information); IC50 values were derived from enzyme activity data (pH 7.4) in the presence/absence of various compound concentrations and diclofenac/midazolam as selective CYP 2C9/CYP 3A4 substrate.
