
Table 5.
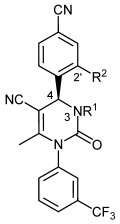
Conformational tuning at N3 and C2′ north: effect on lipophilic binding efficiency.
 | ||||||
|---|---|---|---|---|---|---|
| Compd | R1 | R2 | HNE IC50 [nm][a] | log D[b]/Clog D[c] | LipE[d] | CYP 2C9/3A4 IC50 [μm][e] |
| 22 | H | H | 4.7 | 2.8[b] | 5.6 | 18/>50 |
| 25 | Me | H | 1.6 | 3.6[c] | 5.2 | 23/40 |
| 26 | H | CF3 | 0.6 | 3.2[b] | 6.0 | >50/>50 |
| 27 | Me | CF3 | 0.024 | 3.7[b] | 7.0 | –/>20 |
| 28 | H | SO2Me | 0.540 | 2.7[b] | 7.2 | >50/>50 |
| BAY 85-8501 (29) | Me | SO2Me | 0.065 | 3.0[b] | 7.2 | >50/>50 |
| 30 | Me |  |
0.250 | 3.3[c] | 6.3 | >50/>50 |
The inhibitory capacity of test compounds was assessed by applying functional biochemical assays with the isolated enzyme (Supporting Information); IC50 values were derived from enzyme activity data (pH 7.4) in the presence/absence of various compound concentrations by applying a suitable fluorogenic peptide substrate, MeOSuc-AAPV-AMC.
log D (pH 7.5) was determined by reversed-phase HPLC at physiological pH 7.5. A series of standards were injected for which log D has already been determined using definitive analytical methods (a homologous series of n-alkanones). Plotting of the retention times against their log D generated a calibration curve. The retention time of the test compound was then compared with the calibration curve leading to its log D.
Clog D (pH 7.5) was calculated by using a highly predictive method developed at Bayer, based on data points of experimentally determined log D values of internal pharmaceutical compounds and the Simulations Plus pKa predictor.[23]
Calculated as LipE=pIC50−log D.[24]
The potency of test compounds to inhibit human CYP 2C9 and CYP 3A4 was investigated with pooled human liver microsomes as enzyme source and selective standard substrates (Supporting Information); IC50 values were derived from enzyme activity data (pH 7.4) in the presence/absence of various compound concentrations and diclofenac/midazolam as selective CYP 2C9/CYP 3A4 substrate.