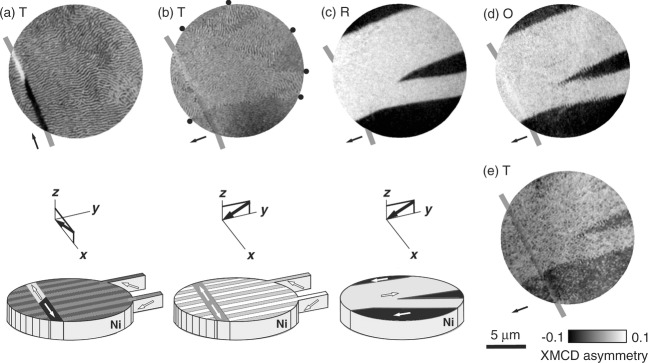
Figure 2.

Thermal control of stripe domains. PEEM images with XMCD contrast for a single region at a) 297 K, b) after rotating the sample 90°, and then at c) 127 K, d) 210 K, and e) 297 K. Panels (a–c) include representative schematics under each image. Black arrows show the IP projection of the incident-beam direction (images), and the incident-beam direction (schematics). White arrows show magnetization directions. Schematics do not show waviness in stripe domains, or variations of IP magnetization. Black dots in (b) indicate boundaries between IP magnetic domains. Thick gray lines mark the long thin feature that is representative of this sample only (Supporting Information Note 3). Data for Sample 1.
