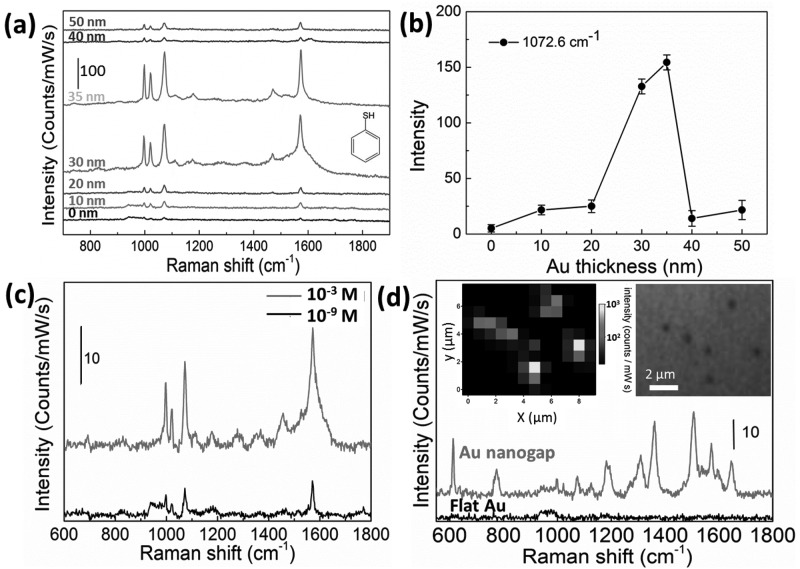
Figure 4.
(a) SERS spectra of thiophenol measured with Au film of different thickness. (b) Relation between the SERS signal intensity of peak at 1072.6 cm−1 and different thickness of Au film deposited. (c) SERS spectra of thiophenol at different concentrations detected from nanogaps formed with Au film thickness of 35 nm. (d) SERS spectra of R6G (10−6 M) measured at the Au nanogaps and control flat Au films. Insets are the SERS mapping and corresponding optical image.

