
Figure 2.
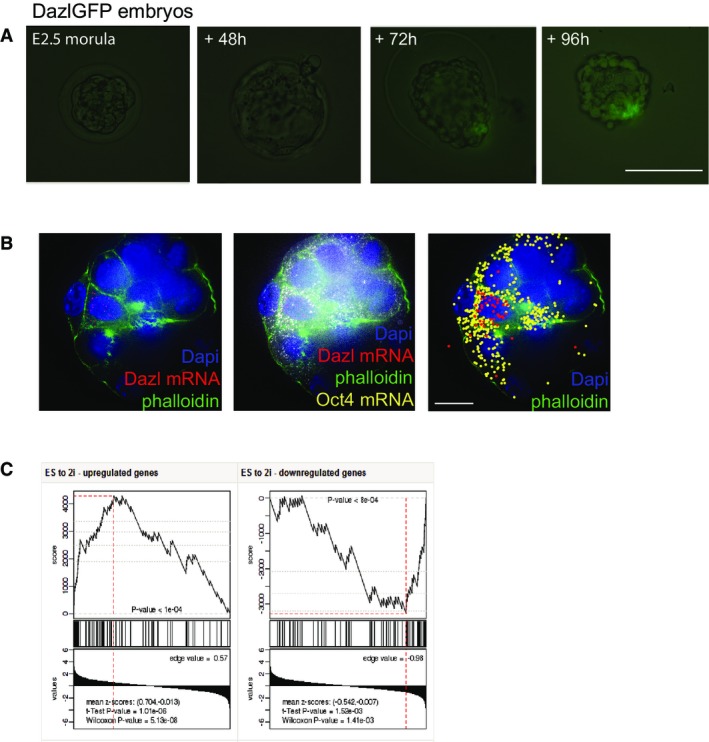
DAZL is expressed in late blastocyst embryos
- DazlGFP embryo cultured in vitro in KSOM from E2.5 morula stage to late blastocyst stage. Scale bar, 100 μm.
- Single-molecule FISH experiment showing single Dazl and Oct4 mRNA molecules in E3.5 blastocyst embryos. Right panel, artificial visualization of single mRNA molecules. Scale bar, 50 μm.
- The top panel of this GSEA plot shows a rank-sum-based score, which is calculated depending on the correlation of the differentially expressed genes in DazlGFP ESCs in 2i conditions with its expression in embryos cultured in 2i conditions vs. control embryos. The enrichment score reflects the degree to which the examined gene set is over-represented at the extremes. The middle panel shows vertical lines corresponding to the rank of the genes in the examined gene set. Here, most of the black lines are clustered to the left meaning that the genes in DazlGFP 2i dataset are among the most upregulated in the embryo 2i measurements. The bottom panel shows the actual expression difference scores from the embryos cultured in 2i conditions vs. control embryos. The overall P-value (shown on the top) is determined based on the value of the rank-sum statistics (top-plot) at its extreme point (marked by a vertical red line).